Sunday, October 20, 2013

Different types of regression

I have always felt that regression is a very versatile tool. It can be used for measurement (to explain what happened), for analysis (to understand drivers) and for forecasting. It has a long history and still has relevance in our analytical suite of tools. 

Some of the evolution of regression is very interesting from the perspective of how shortcomings have been addressed. Some of the main arguments / shortcomings against regression are that it does not handle multicollinearity well (especially when you need driver analysis) and some of the assumptions (like the independence of the errors and the explanatory variables) that never seem to be satisfied. Research on these dimensions have led to improvements in methods that can handle these issues. There are three interesting ideas that I want to highlight in this week's blog post.  

There are many ways to handle multicollinearity in analysis. It's importance is driven by the fact that when one needs to measure the impact of key variables, it needs to be independent of other variables that could bias the measurement. Principal component analysis and factor analysis are options to handling multicollinearity but there are significant challenges in interpreting results after that. Latent class is a good way of handling this (and I will be discussing this in the future). Ridge (and Lasso) regression is a simple idea of handling multicollinearity in regression. Conceptually in Ridge regression, to handle multi-collinearity in the data, bias is introduced in the data. This has the effect of reducing the variance in the data which leads to better estimates from an analysis perspective. 

One other disadvantage of least squares regression is it's lack of flexibility. Variable transformations and interactions do add a lot of flexibility but there is one technique that adds a lot more flexibility. Local regression (also known as LOESS regression (or LOWESS - locally weighted least squares)) adds the flexibility that many machine learning techniques have. It does bring in some elements of computational intensity required to handle this but can add the flexibility to deliver interpretable results. Local regression basically creates local subsets to build models on and can hence manage very non-linear relationships well. 


One interesting issue in regression usage has been the difficulty in dealing with counter-intuitive results. Bayesian Regression provides an approach to formulate hypothesis that can be incorporated into the regression analysis. This can help bring in prior knowledge to play an important role in the analysis while minimizing very counter-intuitive results. Of course, as with all regression techniques, the modeler will need to use his intelligence to get to the best models.

In any case, there is a lot more to regression than meets the eye! 

Tuesday, October 8, 2013

R and Shiny

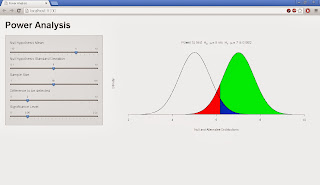
After my previous post on Julia, I wanted to get back to R to ensure that I have explored everything it has to offer. In an attempt to learn something new, I decided to take on the world of HTML5 and Javascript and visualization and teaching. All this came together in one single R package called Shiny. This package is quite neat as it allows you to create web applications for statistical analysis. In the interest of learning something new and being able to teach something that I like, I decided to create a web application for power analysis. 
It might be a simple thing for many folks but I wanted to showcase the power of Shiny along with some new found knowledge that I gained about R. 

First Shiny - It has two sides, a UI side which defines the front end and Server side which hosts the R program that runs on the background. The UI side has the layout and inputs element of the webpage and the Server side generates the output that is needed. You typically work the statistical side on the Server side. On my localhost, it was quite fast and you do not notice the lag in terms of changing inputs and observing outputs. 

A few things that I learned in this process which are slightly ancillary to Shiny! 

1. How to plot multiple elements in a single graph. The one that I have here has about 6 element in the graph.
2. How to get Greek letters to work in R. Did not know that it could be done but figured it had to be the case as this at the end of the day is a statistical package.
3.How do I actually demo the impact of sample size and significance level to students and show them that it is not always about having alpha = 0.01 that makes it better.
The big deal about Shiny is that it enables you to have discussions around analysis with your clients / partners in a very interactive manner. This allows you to explore the full dimension of the analysis with the business partner and hence get to better decisions in the long run. In the near future, it has helped me build something that I thought needed to be built. I am going to do more to showcase regression results. There are a few examples here that are worth exploring.

Wednesday, October 2, 2013

Another Statistical Language

From a talk that I recently attended, I learnt about a new statistical language. Now the initial question that I had before attending the talk was why do I need a new language. However even after the talk, I could not really get a good handle on the answer to that. Even though a lot of analytics professionals do not look at SAS as a statistical language, there are those among us who are quite comfortable with that idea and can live with R and SAS. So why do we need another language?

The talk by itself was relatively interesting. The language was Julia and the speaker was Viral Shah who was one of the founders of the language. Since the perspective from the founder of anything is about why they did something, it usually makes for an interesting talk. I learned interesting stuff about the different elements of rating (or evaluating) a programming language. These elements can change as hardware and technology improve. (Hence you could always see the arrival of new languages in the future.)

The first thing of interest in the talk was the fact that there exists a million (well may not be that many) languages out there. They differ from each other in some fashion or the other making them the preferred language for some and the not so preferred for others. Some like C and Fortran have history (and speed) associated with them. Others like Matlab (and Ocatave from the open source world) have some mathematical flavor in their workings. Others like S and R which have a stats flavor that have their own followers. It makes for a very different world and at some level it does not enable people to talk to each other. This is apart from the typical Stat analysis packages like SAS, TREENET, SYSSOFT etc. that people use for day to day analysis and data manipulation.

Anyways Julia is supposed to be a new paradigm in technical computing. It does have some noteworthy features including beating the crap out of other packages on key speed benchmarks and is open source but I just lost track of some of the other features. It is faster as it has a JIT compiler (to be honest, I am not sure how this helps and I am not even sure if this is why it is faster) but it does not run into interpretation challenges that R has (at least from my understanding). It is optimized for parallel computing (and I thought even R had it but now I am not sure!) There are other features I am sure but what is interesting is how the community around this is growing. They already have more than 175 packages as far as I understand in a span of less than a year going public!

It looks like there is going to be multi-core support coming soon as well as some level of support for GPU computing. The question is whether the world would have moved on since! I want to think that this is the day of everything happening online and so there will soon be a world where you do not have to download anything. You just work with your browser and you are set (which makes trying new software a cinch!)! I am not sure where that leaves me though. I am still playing with R to the extent that everyday feels like I have discovered new features of a toy (wait for my next post!)! Not sure how to make the switch!