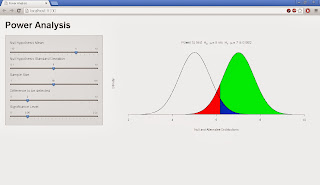
After my previous post on Julia, I wanted to get back to R to ensure that I have explored everything it has to offer. In an attempt to learn something new, I decided to take on the world of HTML5 and Javascript and visualization and teaching. All this came together in one single R package called Shiny. This package is quite neat as it allows you to create web applications for statistical analysis. In the interest of learning something new and being able to teach something that I like, I decided to create a web application for power analysis.
It might be a simple thing for many folks but I wanted to showcase the power of Shiny along with some new found knowledge that I gained about R.

A few things that I learned in this process which are slightly ancillary to Shiny!
1. How to plot multiple elements in a single graph. The one that I have here has about 6 element in the graph.
2. How to get Greek letters to work in R. Did not know that it could be done but figured it had to be the case as this at the end of the day is a statistical package.
3.How do I actually demo the impact of sample size and significance level to students and show them that it is not always about having alpha = 0.01 that makes it better.
The big deal about Shiny is that it enables you to have discussions around analysis with your clients / partners in a very interactive manner. This allows you to explore the full dimension of the analysis with the business partner and hence get to better decisions in the long run. In the near future, it has helped me build something that I thought needed to be built. I am going to do more to showcase regression results. There are a few examples here that are worth exploring.


No comments:
Post a Comment