Sunday, October 20, 2013

Different types of regression

I have always felt that regression is a very versatile tool. It can be used for measurement (to explain what happened), for analysis (to understand drivers) and for forecasting. It has a long history and still has relevance in our analytical suite of tools. 

Some of the evolution of regression is very interesting from the perspective of how shortcomings have been addressed. Some of the main arguments / shortcomings against regression are that it does not handle multicollinearity well (especially when you need driver analysis) and some of the assumptions (like the independence of the errors and the explanatory variables) that never seem to be satisfied. Research on these dimensions have led to improvements in methods that can handle these issues. There are three interesting ideas that I want to highlight in this week's blog post.  

There are many ways to handle multicollinearity in analysis. It's importance is driven by the fact that when one needs to measure the impact of key variables, it needs to be independent of other variables that could bias the measurement. Principal component analysis and factor analysis are options to handling multicollinearity but there are significant challenges in interpreting results after that. Latent class is a good way of handling this (and I will be discussing this in the future). Ridge (and Lasso) regression is a simple idea of handling multicollinearity in regression. Conceptually in Ridge regression, to handle multi-collinearity in the data, bias is introduced in the data. This has the effect of reducing the variance in the data which leads to better estimates from an analysis perspective. 

One other disadvantage of least squares regression is it's lack of flexibility. Variable transformations and interactions do add a lot of flexibility but there is one technique that adds a lot more flexibility. Local regression (also known as LOESS regression (or LOWESS - locally weighted least squares)) adds the flexibility that many machine learning techniques have. It does bring in some elements of computational intensity required to handle this but can add the flexibility to deliver interpretable results. Local regression basically creates local subsets to build models on and can hence manage very non-linear relationships well. 


One interesting issue in regression usage has been the difficulty in dealing with counter-intuitive results. Bayesian Regression provides an approach to formulate hypothesis that can be incorporated into the regression analysis. This can help bring in prior knowledge to play an important role in the analysis while minimizing very counter-intuitive results. Of course, as with all regression techniques, the modeler will need to use his intelligence to get to the best models.

In any case, there is a lot more to regression than meets the eye! 

Tuesday, October 8, 2013

R and Shiny

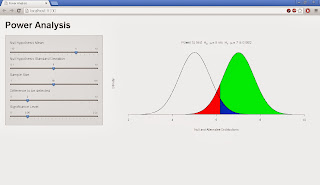
After my previous post on Julia, I wanted to get back to R to ensure that I have explored everything it has to offer. In an attempt to learn something new, I decided to take on the world of HTML5 and Javascript and visualization and teaching. All this came together in one single R package called Shiny. This package is quite neat as it allows you to create web applications for statistical analysis. In the interest of learning something new and being able to teach something that I like, I decided to create a web application for power analysis. 
It might be a simple thing for many folks but I wanted to showcase the power of Shiny along with some new found knowledge that I gained about R. 

First Shiny - It has two sides, a UI side which defines the front end and Server side which hosts the R program that runs on the background. The UI side has the layout and inputs element of the webpage and the Server side generates the output that is needed. You typically work the statistical side on the Server side. On my localhost, it was quite fast and you do not notice the lag in terms of changing inputs and observing outputs. 

A few things that I learned in this process which are slightly ancillary to Shiny! 

1. How to plot multiple elements in a single graph. The one that I have here has about 6 element in the graph.
2. How to get Greek letters to work in R. Did not know that it could be done but figured it had to be the case as this at the end of the day is a statistical package.
3.How do I actually demo the impact of sample size and significance level to students and show them that it is not always about having alpha = 0.01 that makes it better.
The big deal about Shiny is that it enables you to have discussions around analysis with your clients / partners in a very interactive manner. This allows you to explore the full dimension of the analysis with the business partner and hence get to better decisions in the long run. In the near future, it has helped me build something that I thought needed to be built. I am going to do more to showcase regression results. There are a few examples here that are worth exploring.

Wednesday, October 2, 2013

Another Statistical Language

From a talk that I recently attended, I learnt about a new statistical language. Now the initial question that I had before attending the talk was why do I need a new language. However even after the talk, I could not really get a good handle on the answer to that. Even though a lot of analytics professionals do not look at SAS as a statistical language, there are those among us who are quite comfortable with that idea and can live with R and SAS. So why do we need another language?

The talk by itself was relatively interesting. The language was Julia and the speaker was Viral Shah who was one of the founders of the language. Since the perspective from the founder of anything is about why they did something, it usually makes for an interesting talk. I learned interesting stuff about the different elements of rating (or evaluating) a programming language. These elements can change as hardware and technology improve. (Hence you could always see the arrival of new languages in the future.)

The first thing of interest in the talk was the fact that there exists a million (well may not be that many) languages out there. They differ from each other in some fashion or the other making them the preferred language for some and the not so preferred for others. Some like C and Fortran have history (and speed) associated with them. Others like Matlab (and Ocatave from the open source world) have some mathematical flavor in their workings. Others like S and R which have a stats flavor that have their own followers. It makes for a very different world and at some level it does not enable people to talk to each other. This is apart from the typical Stat analysis packages like SAS, TREENET, SYSSOFT etc. that people use for day to day analysis and data manipulation.

Anyways Julia is supposed to be a new paradigm in technical computing. It does have some noteworthy features including beating the crap out of other packages on key speed benchmarks and is open source but I just lost track of some of the other features. It is faster as it has a JIT compiler (to be honest, I am not sure how this helps and I am not even sure if this is why it is faster) but it does not run into interpretation challenges that R has (at least from my understanding). It is optimized for parallel computing (and I thought even R had it but now I am not sure!) There are other features I am sure but what is interesting is how the community around this is growing. They already have more than 175 packages as far as I understand in a span of less than a year going public!

It looks like there is going to be multi-core support coming soon as well as some level of support for GPU computing. The question is whether the world would have moved on since! I want to think that this is the day of everything happening online and so there will soon be a world where you do not have to download anything. You just work with your browser and you are set (which makes trying new software a cinch!)! I am not sure where that leaves me though. I am still playing with R to the extent that everyday feels like I have discovered new features of a toy (wait for my next post!)! Not sure how to make the switch! 

Saturday, September 21, 2013

Analytics education... What is the best way to get ideas across?

While trying to figure out what to do in life, I am in the process of exploring the analytics education space. Given my background in this space, and the goal of retiring into this job, I have been thinking about this for a while. However I have not done a whole lot till in this space other than do some trainings in a haphazard manner till the beginning of this year. 

I am a firm believer in the idea that if you want to learn something you need to teach it (hopefully to a bunch of interested folks). I have developed some perspectives on what it takes to be a good business analyst and there is significant element of business inputs needed for that. However the quantitative element is very important as business intuition takes time time to develop. The focus on this element is minimal though in most education programs until recent times. MBA programs are now introducing more rigorous quant subjects and can actually make a full time quant MBA a possibility soon. Is it possible to make it better now? It feels like it should be available in college also and not just in specialized MBA programs.

In the interest of my personal journey, I have decided to do a couple of things. Take a step back and do some learning. I have signed up for a couple of topics in Coursera to see how it feels to learn something in a new world. I might be challenged also from a pure discipline perspective but I will need to try. The second thing that I am trying to do is evaluate different mediums from the perspective of analytics learning. My particular interest would be in quantitative subjects but this will be an interesting experience for me to explore other areas also as there will be significant learnings that I am hoping to get. These different mediums span the breadth of technology from the plain classroom to the Android / Windows / Iphone app. There seems to be a sea change in this world from the time I studied many of these subjects.


I have been talking to the director of a leading MBA education institution in Bangalore about conducting training at their location. This scenario seemed like a good place to start looking at how outsiders take to analytical education as compared to insiders. (My perspective is when you pay for it, you are more than willing to learn but if it is free then who cares - I am a shining example of this). A colleague of mine introduced me to a company that does coaching. I need to see how that will work out but I am struggling to get my thoughts on my future in order. It looks like there is some potential to do some interesting stuff there too. 

Friday, September 13, 2013

Treenet and Stochastic Gradient Boosting

While I am someone who likes to go deep into techniques, I rarely get the time (maybe some intellectual honesty would require me to say that I get distracted easily by what is happening around me) to understand something technical. However there is an expectation that "I get it faster!" So for this week, I wanted to actually get deep into one such thought process and bring out concepts into simple intuitive ideas.

This week I want to get into Stochastic Gradient Boosting. Purely because I understand it well enough to explain I guess but another reason that is a little more personal is the fact that I had a dinner conversation with the inventor of this methodology. Jerome Friedman made a presentation at and event at my previous job and since I was organizing the event I was able to meet up with him for dinner along with a few other colleagues. It always feels good to be with statistical royalty and these folks are quite down to earth. While dinner was good, the conversation was better as we learned about his Princeton days when he was colleagues with John Nash the famous Nobel Prize winning economist.

Anyways coming to the key idea of this blog!!! Stochastic gradient boosting is an approach used to improve supervised learning methods. In a typical classification problem accuracy needs to be improved without overfitting the data. With any algorithm, all one can typically do is come up with better features to improve the model. There is significant learning to be had from classification error though. Wherever error is high, there is an opportunity for improvement. Modeling the error (based on any algorithm that you have already used to get this far) will allow you to further reduce it. However, there is one problem to watch out for. Errors are technically independent of the model being developed and hence we need to watch out for spurious relationships. Penalizing the error reduces the impact of these variables being able to significantly impact the analysis unless there is value coming through them being in the model. This in a nutshell is SGB and Treenet is a commercial implementation of this for decision tree algorithms.

R also has an implementation of Stochastic Gradient Boosting. Actually it has many. The GBM package is a good place to start as it has simple implementation of Bagging and one can start exploring more advanced packages that implement boosting for other algorithms including regression (l2boost) and SVM (wSVM).

I guess as a next step I should read Jerome Friedman's paper and synthesize this! 

Monday, September 9, 2013

Analytical software for analysts - are they way too complex?


Are there analytical software out there that actually make learning from data intuitive? I have experience with quite a few of these packages but none of them are intuitive for the average business analyst without making them useless after looking at data in one or two dimensions. While this is good for business, I must admit that it makes life difficult as the problems one has to tackle get quite mundane when responding to queries from the not so statistically literate. 

What would be the ideal requirements for one to actually be able to get ideas from data? Let us assume that the average user has a sense of the business he / she is dealing in. At the end of the analysis he should be able to get a sense of how to drive the business forward or at least has a good sense of what are some of the drivers that would explore further. Let us further assume that the average business user also has the ability to understand counter-intuitive results and can basically understand two dimension analysis and can possibly understand three dimension analysis but will be unable to move forward beyond that. 

Ideally when my business problems are well-defined (in the sense that I at least know what I want to solve initially even though I might realize that I need to solve something much larger later), then these tools should be able to at least drive some initial value for the analysts by incorporating these business requirements. But when I am sifting through data without a clue as to what I am looking for, how do I identify patterns that are meaningful and at the same time not require me to be in that business domain forever?

Regression analysis required significant understanding of the statistics to be able to confidently drive the analysis. CART / CHAID type algorithms are relatively easier to understand but I am not sure if there are decent implementations of a software that makes the learning from CHAID / CART intuitive. Bayesian networks or topological data analysis might be an answer but I have not worked enough with these to have a viewpoint on the implementation perspective. These are good with identifying patterns but do not necessarily make it easier for the business to get their reads better.

Ultimately I believe business problems need to be solved with the business context in mind and there are no general software that will enable that. Is it time for one to be created?

Saturday, September 7, 2013

To Bayes or not to Bayes

Why is this argument important? For a long time, the argument of the frequentist approach was that the the data generating mechanism had a distribution where the parameters that described the distribution were fixed. While this made sense initially (why would that parameter change in any case) and all you would do would be to estimate that parameter based on the data that you observe. However Bayesian inference came into the world much later and postulated (I am not sure who did it specifically) that I should be using any prior information that I have about the parameter estimate and not necessarily let it be driven purely by data.

While this in theory sounded quite radical initially, there have been significant contributions that have enabled this idea to be used successfully in very practical applications. Specifically, Bayesian regression is quite useful to build updating models by using continuous data collection mechanism as opposed to waiting till models deteriorate to the point of having to be rebuild. This can incorporate a good test and learn setup from a data input perspective. These models have very practical applications in credit scoring, churn analysis and customer acquisition.

The machine learning world took to Bayes theorem a lot more seriously than the statistical crowd. Algorithms which assumed prior knowledge and then were updated based on fresh data seemed to make a lot more sense. Spam filtering is one of the biggest application of this theorem. A general rule to define spam based on many emails can be a baseline, and the model can then be updated based on user characteristics and performance. This allows the spam filter to be very customized to the user.

Judea Pearl is one of the pioneers in looking at Bayesian Inference from a fresh new perspective. Graph theory has been in mathematics for quite a long time. However the usage of Bayesian theory enabled a fresh new perspective in this domain and Bayesian Networks is the result of this marriage. The network structure allows one to incorporate a lot more variables in the model and measure causal relationships which previously was only available in the time series domain (Will write on this later!).

The bottom line that I see is that the frequentist approach is outdated and we need to develop that perspective when looking at new models. This should be the way we think of incorporating models in the real world.

Tuesday, August 27, 2013

Machine learning ... will it tell me the future?

I recently got pulled into a conversation with one of our really smart analysts. He has a dreamy vision of getting into bureaucratic India and at the same time is really smart when it comes to coding. We got talking and he started describing this competition on Kaggle. While I heard him out and was also getting a bit excited about doing something hands on, I realized that the industry has really grown around me and I have not had the chance to appreciate the growth.

Kaggle is one of many websites that offer competitions. KD Nuggets, Analytic Bridge etc. are other sites that have these competitions. What is interesting is where the the solution approaches seeming to be heading to. A few years ago (or maybe many years ago - and it can be a separate blog topic), we (at grad school) discussed the coming of age of machine learning. Given large amounts of data, how can you get accurate predictions for different problems. With the focus being only on predictions, these algorithms were able to meet many statistical techniques purely due to the lack of any constraints that a data generating model would impose on a statistician. Why are we constraining ourselves from a hypothesis perspective? Has statistics lost out on the chance to be the next cool thing in the world and will machine learning take over? It makes sense to understand why is one even relevant in this day and age.

Many machine learning algorithms are inherently black box purely because of the way the characteristics relate to the object that needs to be predicted. While there are ways of understanding which characteristics are important and associated sensitivities, there is potential for it to be misleading if not diagnosed properly. Most machine learning techniques have a significant validation component to ensure that the algorithms are robust and can handle exception cases.

Where does this lead us to? One of the most interesting expectations from machine learning is we can live in a IRobot kind of environment where machines can predict survival rate based on their learning. Google has designed an algorithm that can identify cats (even though I am not sure what it would call it) and there is potential for machines to get smarter with time.

BTW here is a plug for one more analytics competition. Should be fun if you are in college!!! (It is quite rewarding from a financial perspective!)

Monday, August 19, 2013

Statistical paradoxes and their paradoxes!!!!

This happened at work. One of the questions posted by one of our brighter analysts was about Freedman's paradox. We see a lot of work going on in the predictive modeling space across industries where a bunch of variables are being thrown together to get some predictive power on some dependent variable. Sometimes we will get variables which are not related but have some predictive power (hence the paradox). What this made me do was to see what other paradoxes are around in statistics.

A lot of us are familiar with Simpson's paradox. (I will write about this later as this is one of my favorite topics), and Freedman's paradox is related to this one in the sense that we are getting strong relationships when we should expect none.

 A bunch of other paradoxes are a lot more interesting possibly due to my relative ignorance of them. Wikipedia has a link to some of these and I will probably do some in-depth research on these once I am at a better place. 

Lindley's paradox - Very interesting paradox that gives us how we can reach different conclusions based on the same data and the same hypothesis
False positive paradox - When your infection rate is about 1% and you have a test that is 90% accurate in detecting the infection and you test 20% of the population, then your test would have told about 2% of the population that they have the infection when in reality they do not have it and only 0.02% of the population that they actually have the infection correctly. That means almost 90% of the people that you told have the infection actually do not have the infection!!!

Another link that I did some reading on was also good. There are a lot more paradoxes and the mathematical / probability literature has a lot more of them. It would make fun reading for the analytically curios because you would need the ability to recognize these issues when you see them in your day-to-day work.

Monday, August 12, 2013

Can regression measure everything?

For a long time, I have been pushing for a better understanding of regression. Regression gives us insight into the multivariate relationship that exists in the world. It is difficult to visualize these relationships as the number of dimensions can exceed human imagination. For all that complexity though, regression is an ancient concept (by measure of the speed at which new techniques come into the analytics industry). Why has it not been adopted to understand the world a lot more?

I think due to the complexity in visualizing these relationships, there is resistance to using these ideas. I am adamant that people who show me anything think along those lines. There is a chance that some of these insights can be developed based on individual analyses slowly. It will be a challenge to ensure that you can highlight everything.

While people look at regression to tell us what will happen, I believe regression is a tool that is best used for measurement. The more complex the relationship, the more important is to ensure that we get the measurement framework right. The measurement of the impact of engine size on mileage is straightforward, but the measurement of the marketing spend on TV on its impact on sales is not so easy. Due to significant relationships between may contributing factors, teasing out the impact of TV marketing spend is a challenge that marketers have tried to solve with no easy solution. While these aspects might pose challenges to using a regression framework, there are a couple of other places where regression may be misleading.

1. When we have non-linear temporal relationships, a straightforward regression approach will not measure relationships accurately leading to misleading diagnoses.
2. When there is a feedback loop, regression usage might even lead to counter-intuitive relationships. While these relationships may not be difficult to recognize, they need to be measured with other techniques to get the right perspective.

Sunday, August 11, 2013

Why another blog on analytics?

I have been meaning to start this blog for a long time. The analytics industry has matured significantly since I got into my undergrad at Loyola College in Chennai to study statistics. While how I got into this industry is a story by itself, I feel like we are at the cusp of a new revolution in the world which will change the way we (as human beings) operate in the world.

As I read up on these small steps that contribute to this revolution, I want to document this for myself. Since I am aiming to retire into academia, hopefully this will enable me to build enough tidbits of information that will enhance the learning process of myself (and others!)